Trading Model Basics
This page explains the core trading interface and key components of the token page. Full buy/sell guides are covered in separate docs.
Token Page Overview
After launching or clicking a token (e.g., US), you enter the detailed token view.
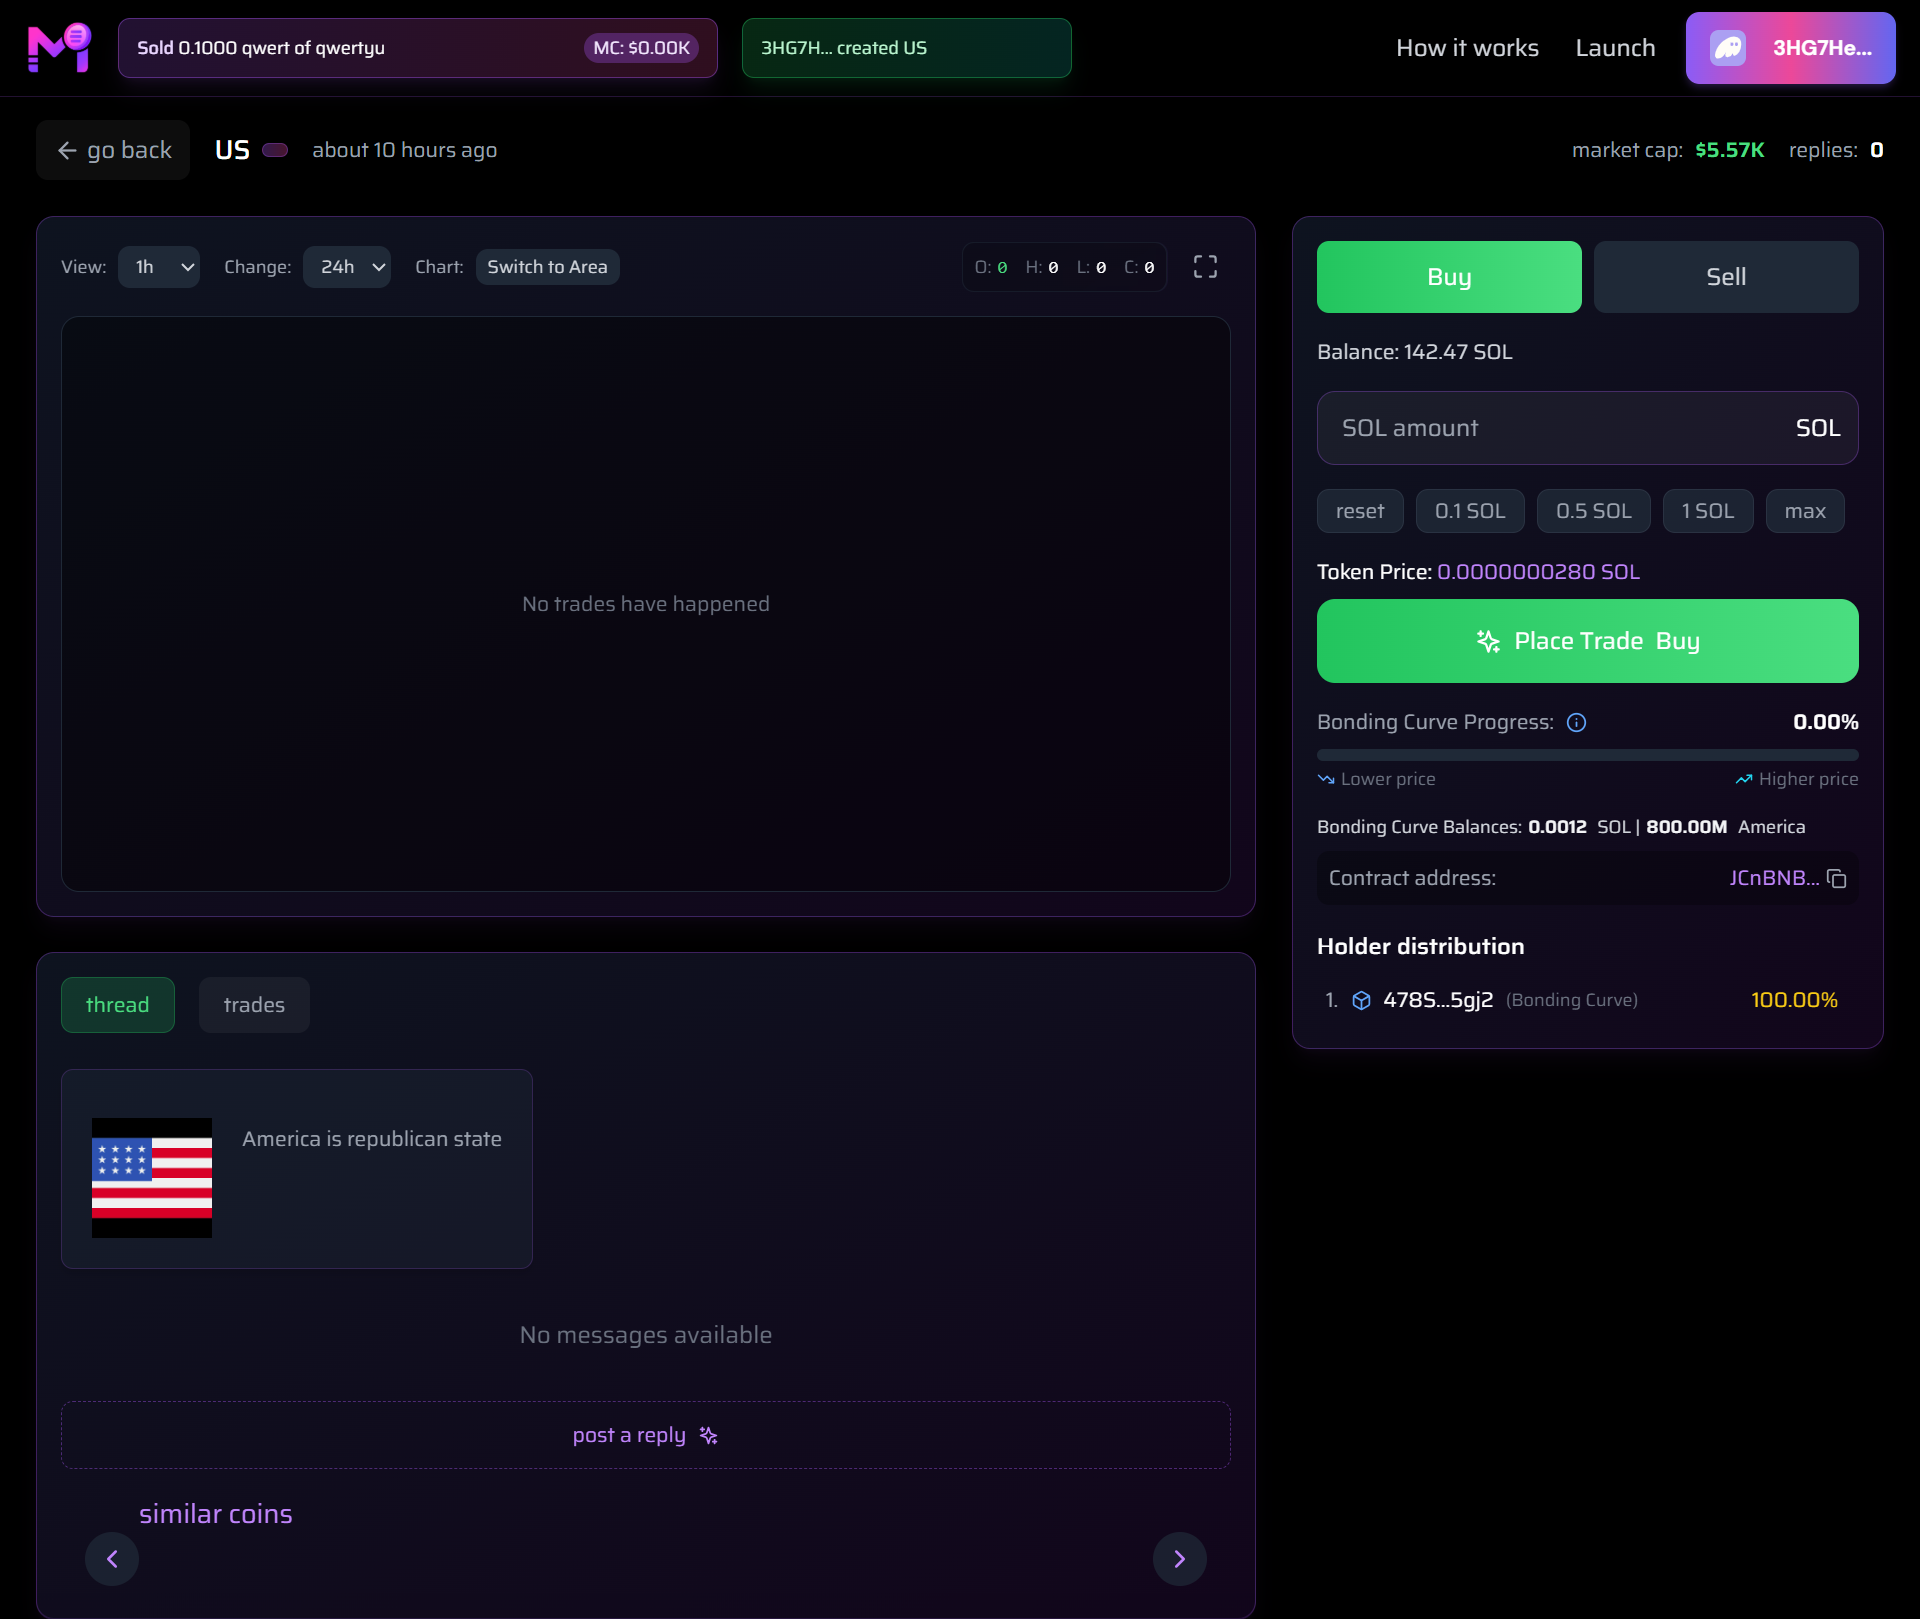
Complete layout: chart, trade panel, thread, and stats
Key Sections
1. Header Info
- Token Name & Age:
US·about 10 hours ago - Market Cap:
$5.57K - Replies:
0 - Creator:
3HG7H... created US
2. Chart Area
- No trades yet → Shows "No trades have happened"
- Once trading starts:
→ Price chart with 1h / 24h view
→ Switch to Area chart mode
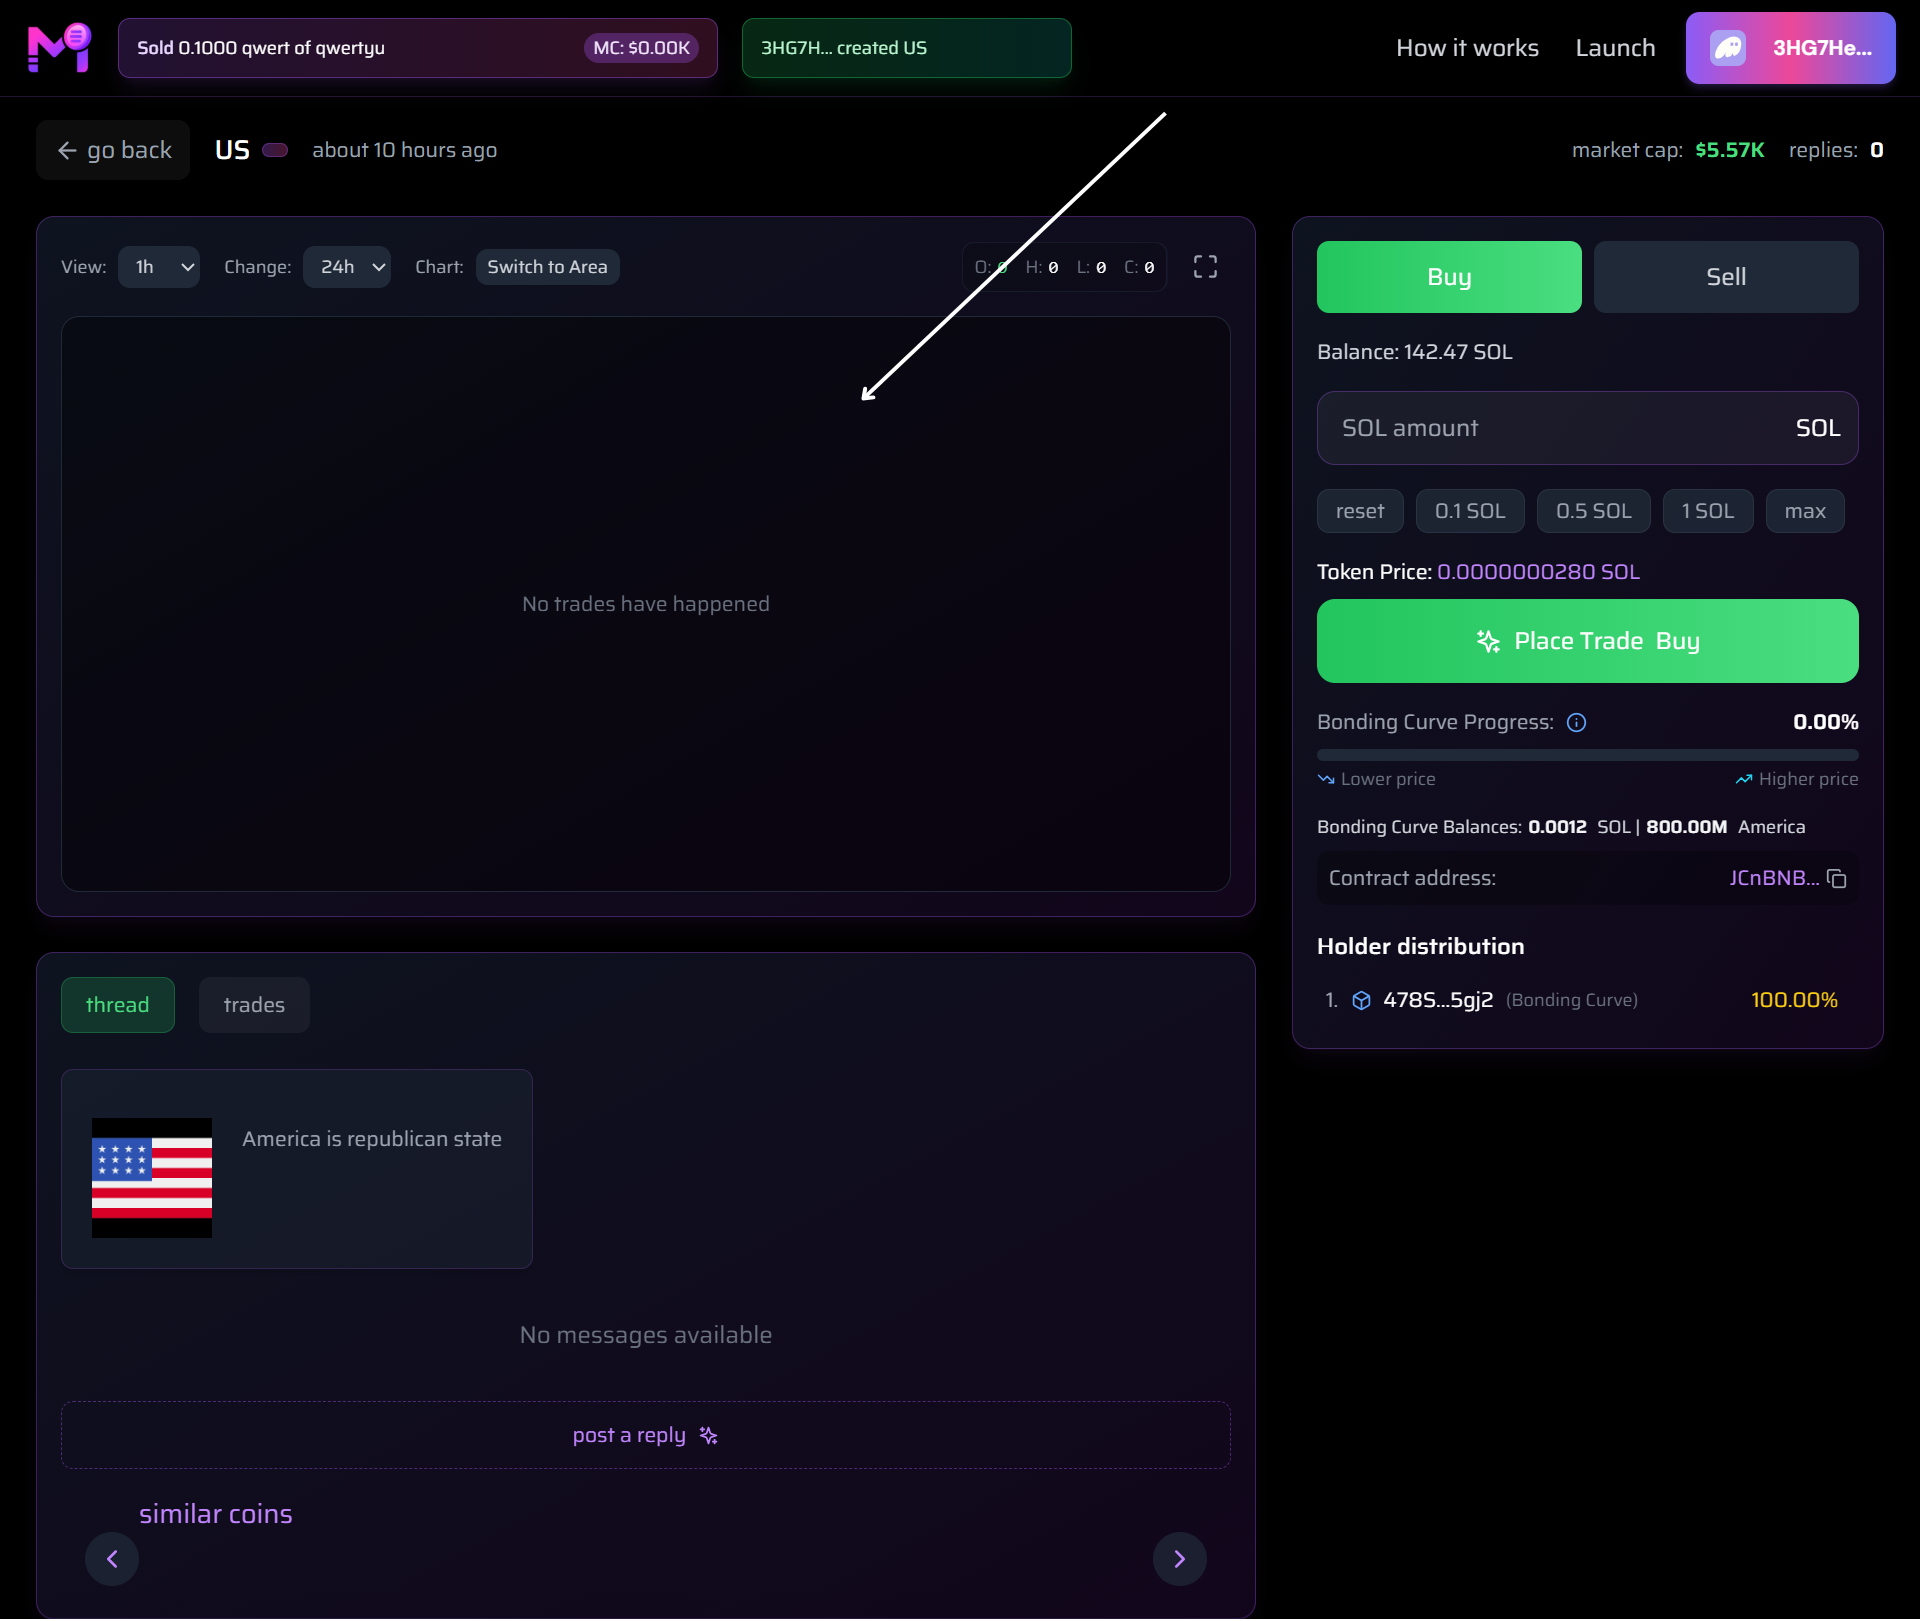
Chart activates after first trade
3. Trade Panel (Right Sidebar)
| Element | Description |
|---|---|
| Buy / Sell Tabs | Toggle between buying and selling |
| Balance | Your SOL: 142.47 SOL |
| SOL Amount Input | Enter or use presets: 0.1 / 0.5 / 1 SOL / max |
| Token Price | Current price: 0.0000000280 SOL |
| Place Trade Button | Green button to execute |
| Bonding Curve Progress | 0.00% → increases with buys |
| Bonding Curve Balances | `0.0012 SOL |
| Contract Address | Click to copy: JCnBNB... |
| Holder Distribution | Top holder owns 100.0% (Bonding Curve) |
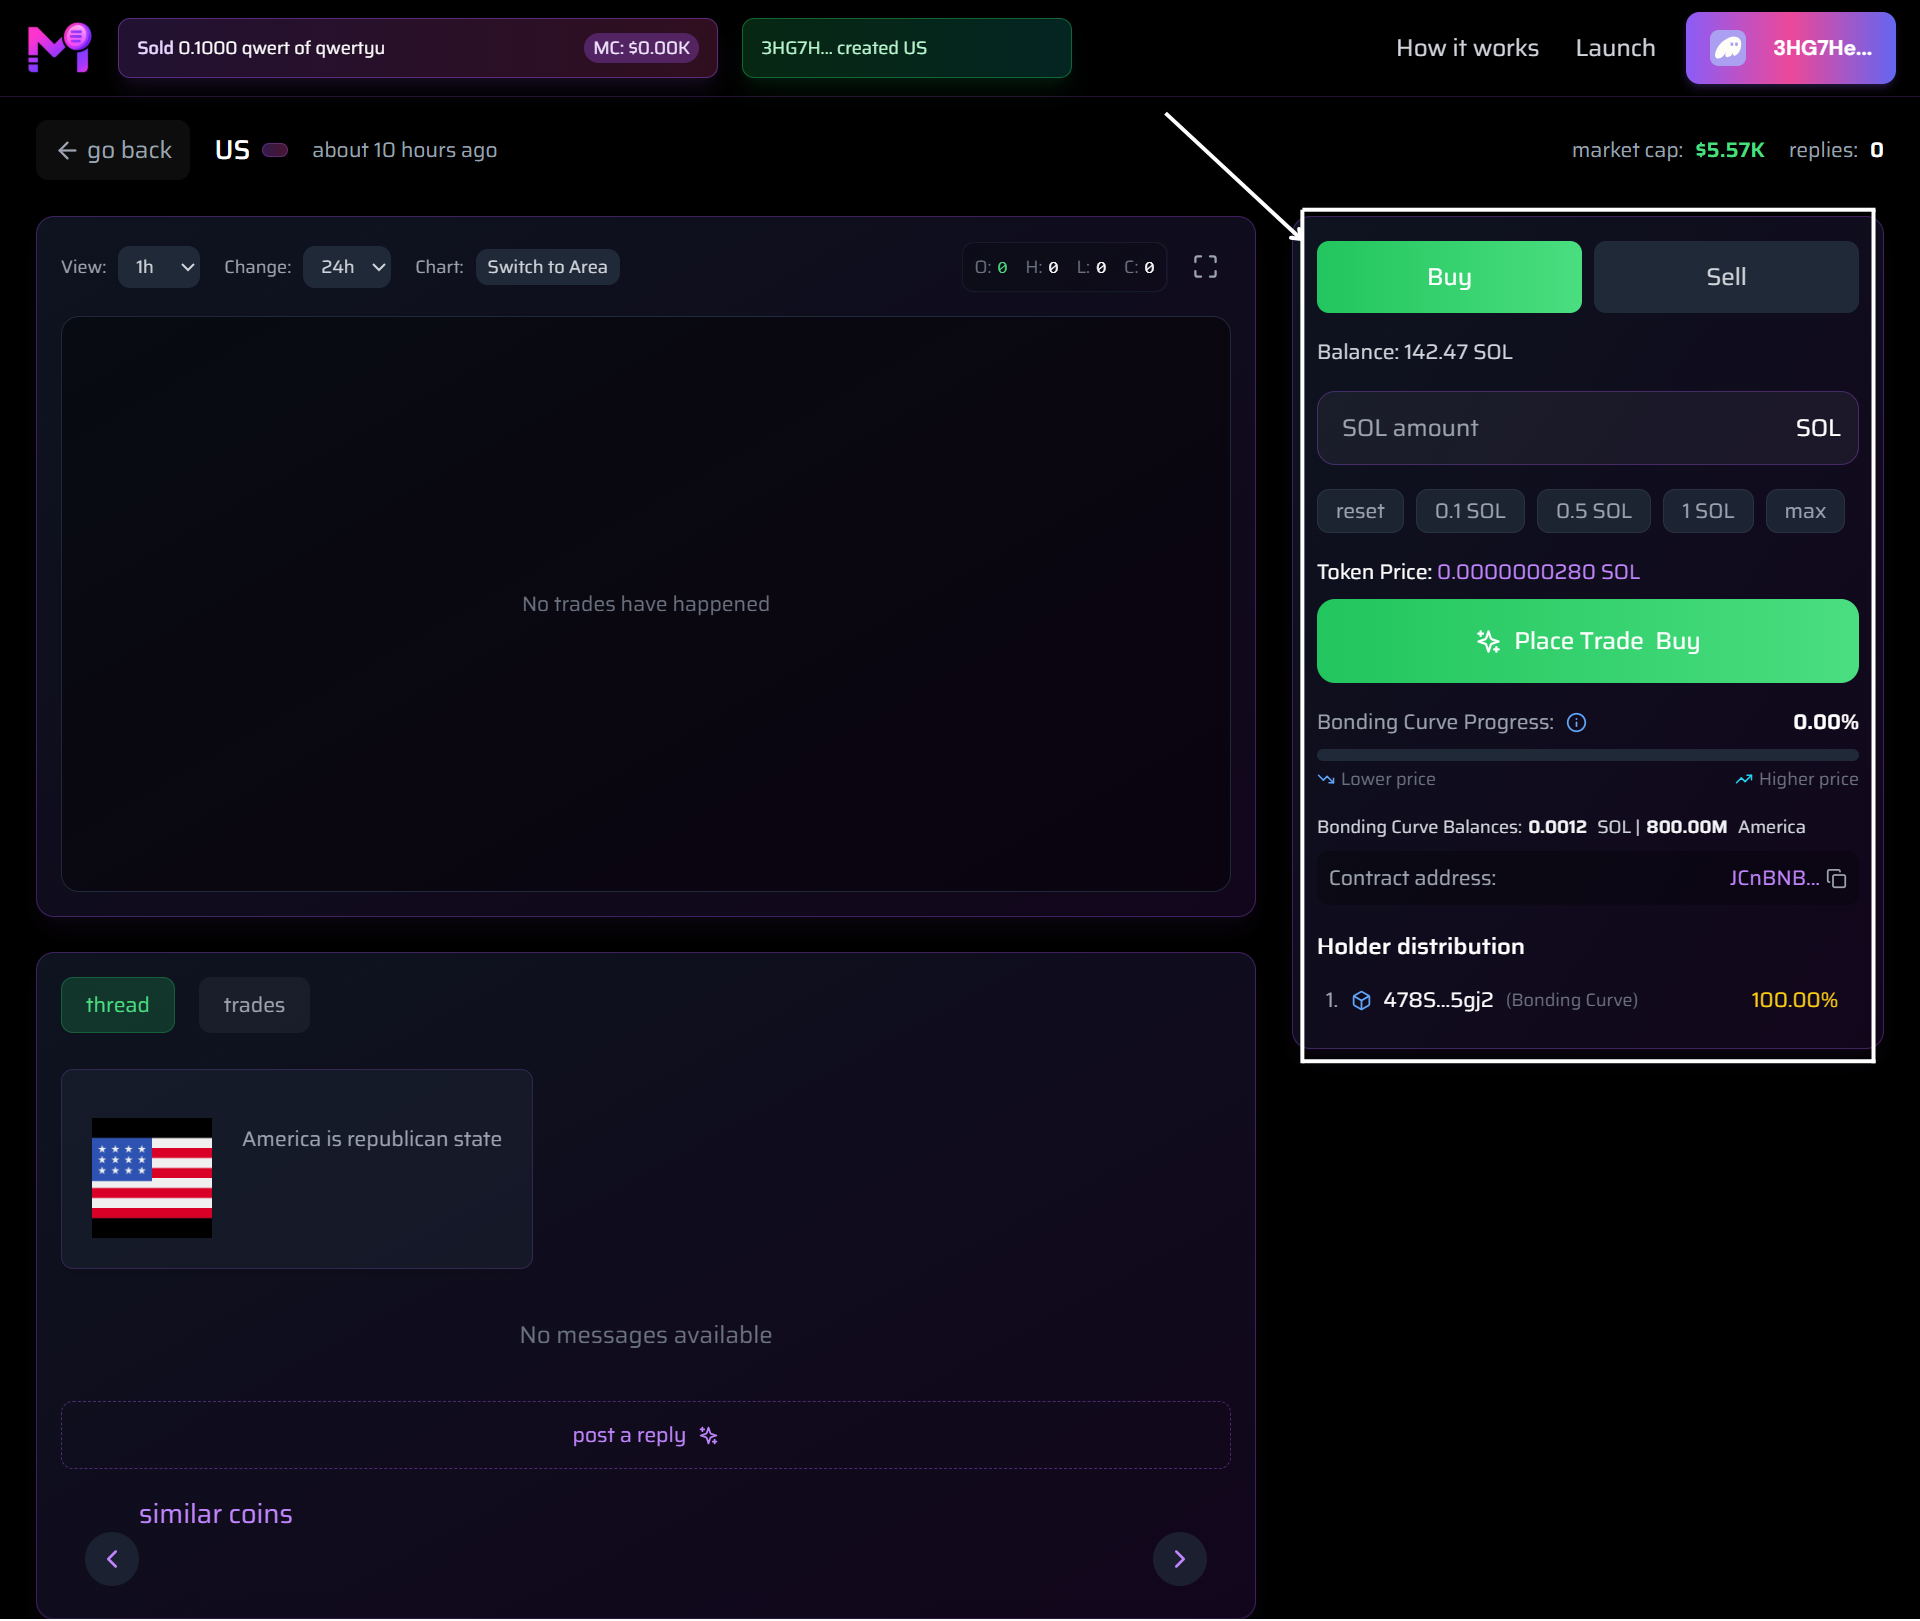
All trading controls in one panel
4. Thread & Replies
- Social discussion area
- Post replies to build hype
- Currently: "No messages available"
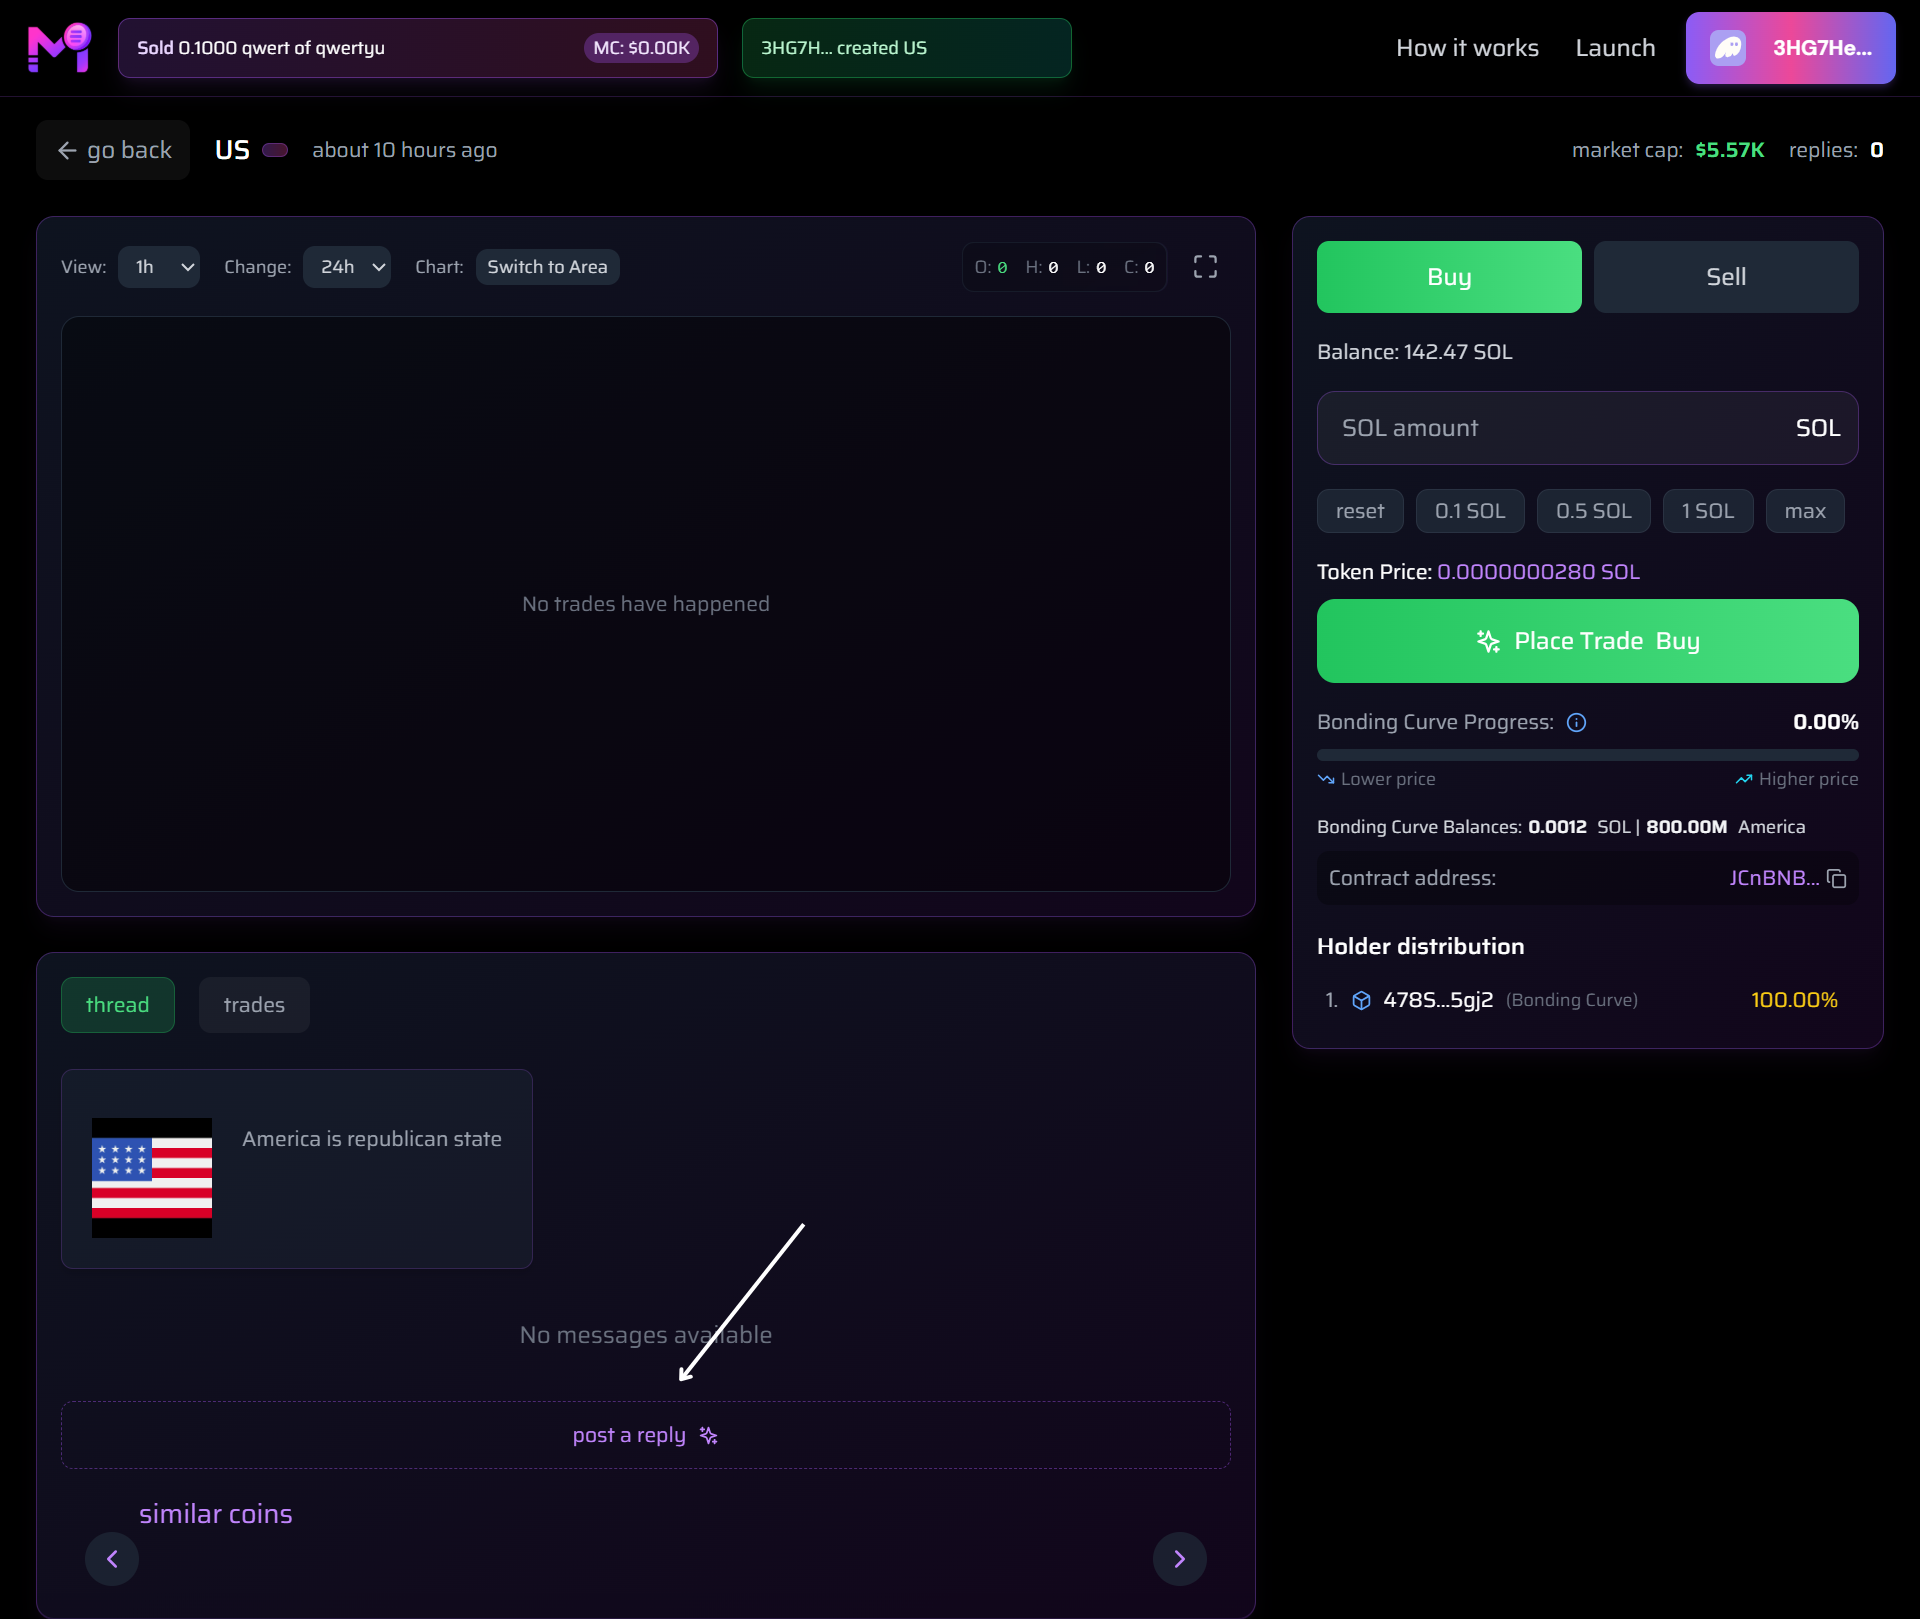
Community interaction zone
Trading Model: Bonding Curve (Simple)
- Price increases as more SOL enters the curve
- Early buyers pay less, later pay more
- No liquidity pools — fully on-chain via bonding curve
- 100% of buys go into curve → fair launch
Detailed buy/sell flow → See Buy Token Guide and Sell Token Guide
Summary Table
| Feature | Status on New Token |
|---|---|
| Chart | Empty until first trade |
| Price | Starts near 0 SOL |
| Holders | 100% = Bonding Curve |
| Replies | 0 until community posts |
| Trading | Enabled immediately |
You're viewing a live, tradable meme coin.